
U.S. Presidential Election
2028 Presidential Election Interactive Map
Colour in the states yourself and watch the electoral college total move, starting either from the 2024 result or an empty map. Below it, what the betting markets currently make of the field.
Interactive Map Projection
Start from the 2024 result or a blank map, then build your own path to 270.
The 2028 field, by market price
Chance of taking office, from Polymarket. Read 24 Sep 2026, 02:53 UTC.
| Contender | Party | Chance of winning |
|---|---|---|
 JD Vance JD Vance |  Republican Republican | 20.7% |
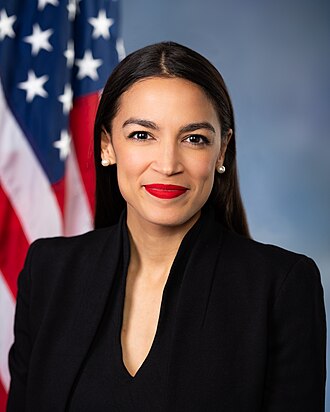 Alexandria Ocasio-Cortez Alexandria Ocasio-Cortez |  Democratic Democratic | 13.5% |
Jon Ossoff | Democratic | 11.5% |
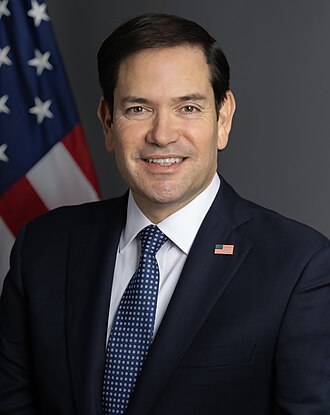 Marco Rubio Marco Rubio | Republican | 8.8% |
 Gavin Newsom Gavin Newsom | Democratic | 8.2% |
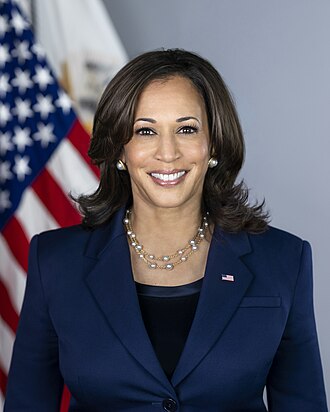 Kamala Harris Kamala Harris | Democratic | 4.4% |
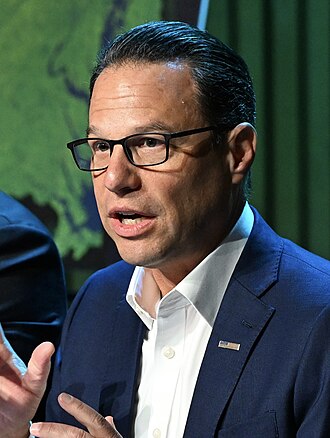 Josh Shapiro Josh Shapiro | Democratic | 3.1% |
 Pete Buttigieg Pete Buttigieg | Democratic | 2.8% |
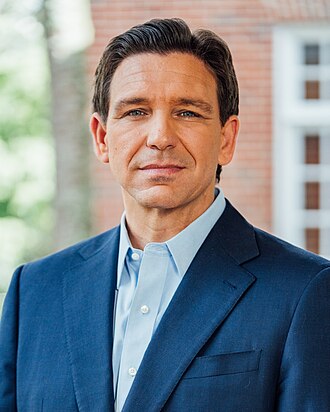 Ron DeSantis Ron DeSantis | Republican | 1.8% |
Mark Kelly | Democratic | 1.7% |
Dwayne 'The Rock' Johnson | Democratic | 1.6% |
Tucker Carlson | Republican | 1.6% |
Contenders priced under 1% are left out. Prices are quoted per candidate rather than carved out of a single pool, so the column does not total 100%.
Which party wins
Polymarket, read 24 Sep 2026, 02:53 UTC.
Where the map starts
The certified 2024 result, which the map above loads in "2024 Result" mode.
A Republican hold in 2028 means defending 312; the Democrats need to flip 44 electoral votes' worth of states to reach 270.
Frequently Asked Questions
How many electoral votes does it take to win?
270 of the 538 available. If nobody reaches 270 — including a 269-269 tie — the election goes to the House of Representatives, where each state delegation casts a single vote.
Is this the official 2028 field?
No, and it cannot be yet: no party has nominated anyone and the first primaries are still years out. The names listed are the contenders who have a tradeable market on Polymarket, ordered by price. People enter and leave that list as traders take an interest in them.
Where do the percentages come from?
They are live prices from Polymarket's 2028 presidential markets, not a forecast produced by this site. A contract pays out if the candidate wins, so its price reads directly as the market's implied probability. Party is worked out by checking which of the two nomination markets prices a candidate higher.
Why do the two party percentages not add up to 100?
Each party is a separate contract rather than a share of one pool, so the prices are quoted independently and the total drifts a little either side of 100. The gap is the spread traders are leaving, not a rounding mistake.
Can I share a map I have built?
Yes. Open the full interactive map and use the Share button for a link or embed code. Your changes stay in the link, so anyone opening it sees your map rather than the default.